
(Above: Example of a RAG Dashboard)
How to R/Y/G (Red–Yellow–Green) in real life
A RAG dashboard is a one-page status scoreboard that uses Red, Amber (Yellow), and Green colors to show what’s on track and what needs help.
-
Green = on target. Keep going.
-
Yellow = slightly off. Take a small corrective action.
-
Red = off track. Escalate and fix now.
What’s on it?
A short list of key metrics (usually 6–8), each with:
-
Metric name (e.g., “Qualified tours/week”)
-
Target (e.g., “≥ 3”)
-
Actual (what happened this week)
-
Status color (R/Y/G)
-
Owner (who’s responsible)
-
Next check date (when to regroup)
-
Notes/Action (what you’ll do next)
Why use it?
-
Makes the health of a project obvious at a glance.
-
Turns meetings into quick decisions, not long debates.
-
Forces one concrete action for every Yellow or Red item.
Simple example (for a vacant bay)
-
Tours/week — Target: ≥3 → Actual: 1 → Yellow → Action: Broker email blast + add 60-sec walkthrough video.
-
Budget variance — Target: ≤+5% → Actual: +12% → Red → Action: Scope review and re-bid two trades this week.
-
LOIs by week 4 — Target: ≥1 → Actual: 0 → Red → Action: Test lower base rent + higher TI package.
How to make one (fast)
-
Open Google Sheets or Excel, make the columns above, add your metrics, and set conditional formatting so the Status cell turns green/yellow/red based on the numbers.
-
Print it and stick it on the project wall; run a 15-minute weekly huddle: each owner says color → why → action.
We love to help, here are downloads for two of the most popular spread sheet formats, download, make a copy, and change the fields as needed for your personal projects, enjoy. : )
Microsoft Excel (link expires on October 31st, 2025: contact us to have link sent to your email):
Download Keek_RAG_Dashboard_Preloaded.xlsx
Google Sheets
Google Option: Import the Excel directly
Google Sheets imports .xlsx very well and keeps formulas + conditional formatting.
-
In Google Drive: New → File upload → select Keek_RAG_Dashboard_Preloaded.xlsx.
-
Open it in Google Sheets → you’re done.
-
The Status column will auto-calc G/Y/R, and colors are preserved.
-
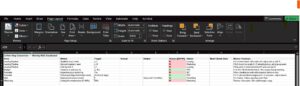
(Above: Image of a RAG Dashboard on spreadsheet software)